Hello, I am
HARI SHANKAR.

1
Excel Project

1
PowerBI Project

1
SQL Project
About Me
Hi, I’m Harishankar, a graphic designer at TNQ Technologies, transitioning into data analytics. My design work taught me to notice small details and present information so people actually understand it. I bring that same approach to data.
I use SQL, Power BI, Python and Excel to clean data, find patterns and turn them into clear dashboards and reports. I’ve built projects in hotel, hardware and sales analysis, and you can see them in the Projects section below.
What I bring: analytical thinking, attention to detail, and the ability to explain insights visually so non-technical teams can act on them. Being a designer helps me choose the right chart, keep layouts clean and tell the story behind the numbers, not just show them.
I’m looking for a Data Analyst role where I can turn data into clear, actionable decisions. Open to connecting with fellow analysts and recruiters.
Key Skills
CTEs
window functions
data modeling
NumPy
formulas
Data cleaning and preparation
Exploratory data analysis (EDA)
Data visualization and dashboard design
Data storytelling
Visual design and layout
Presenting insights to non-technical audiences
Analytical thinking
Attention to detail
Problem solving
Communication
joins
DAX
aggregations
interactive dashboards
Pandas
Matplotlib/Seaborn
Pivot Tables
Power Query
My Experience
Graphic Designer, TNQ Technologies
Feb 2020 to Present
- Design and deliver visual content for publishing and client projects, maintaining accuracy and consistency across large volumes of work
- Check layouts and details carefully so output meets quality standards and deadlines
- Work with Quality Control, Master Copy, Copy Editing and Operations teams to turn requirements into clear, easy-to-read visuals
- Apply visual design principles that now support my dashboard and data storytelling work
Practical Data Analytics Projects
1. AtliQ Hotels Analysis (Python): analysed bookings, occupancy and revenue, and presented insights in a deck
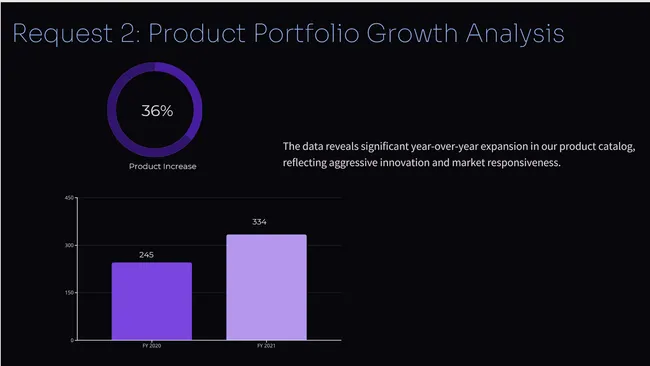
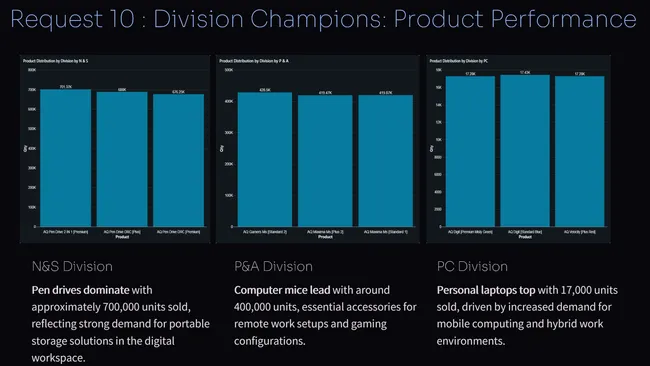
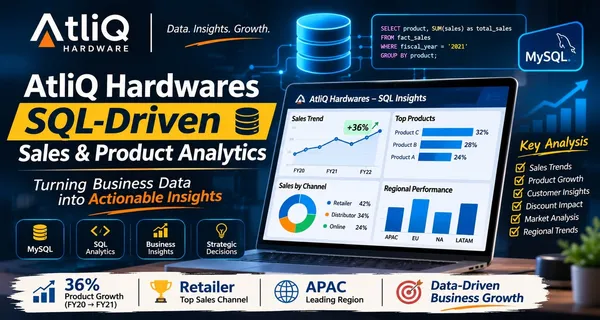
2. AtliQ Hardware Business Analysis (SQL): answered business questions using SQL queries
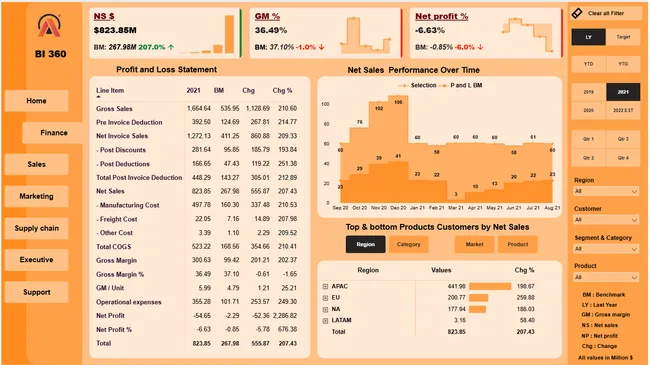
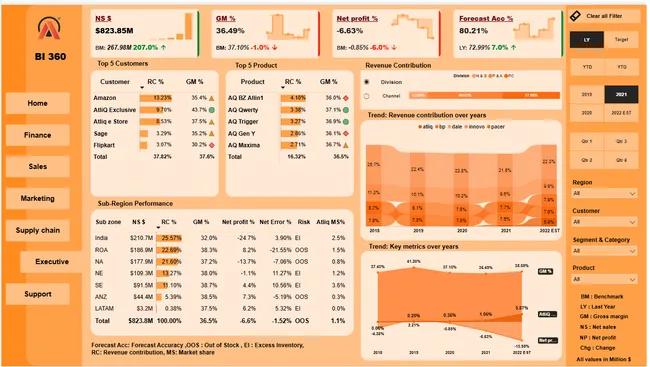
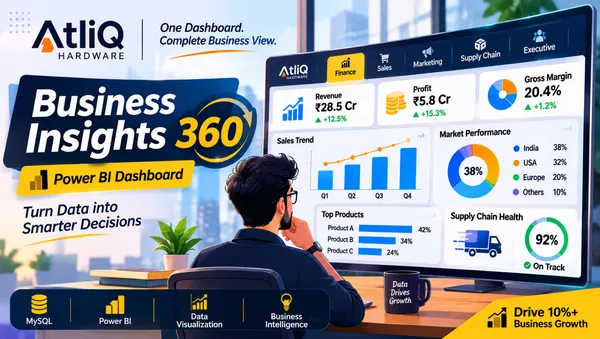
3. Business 360 Dashboard (Power BI): interactive dashboard for business performance tracking
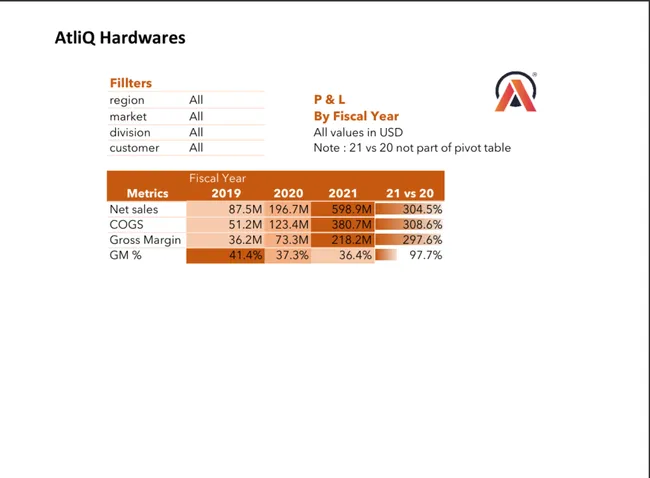
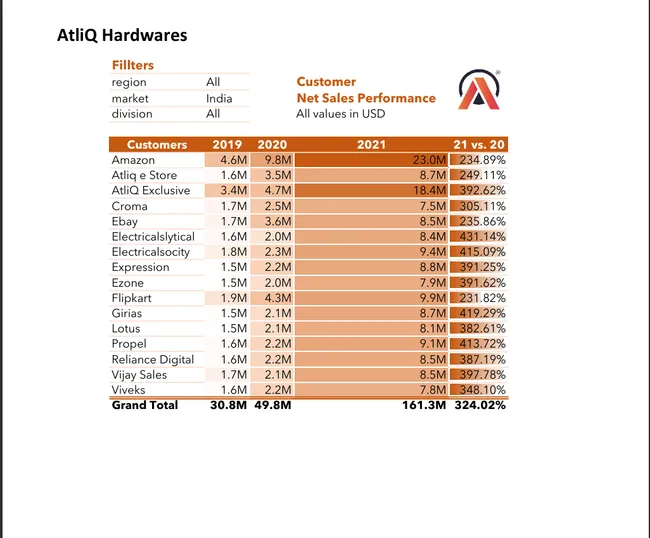
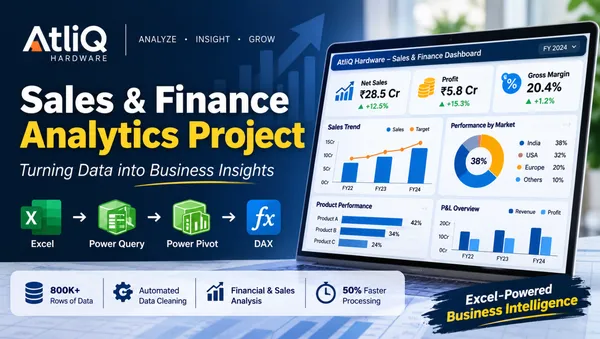
4. Sales & Finance Report (Excel): sales and finance reporting with key metrics in one view
More projects, with links and full details, are in the Projects section.
Awards & Certificate

Excel: Mother of Business Intelligence

Get Job Ready: Power BI Data Analytics for All Levels 4.0

SQL Beginner to Advanced For Data Professionals
Let's Connect
Feel free to get in touch with me. I am always open to discussing new projects, creative ideas or opportunities to be part of your visions.