PowerBI Project

Data Engineering Project

Python Project
I’m Shubham Bhondve, a Data Analyst with 4.5+ years of experience in e-commerce and service operations, specializing in Power BI, SQL, data modeling, ETL, and business analytics.
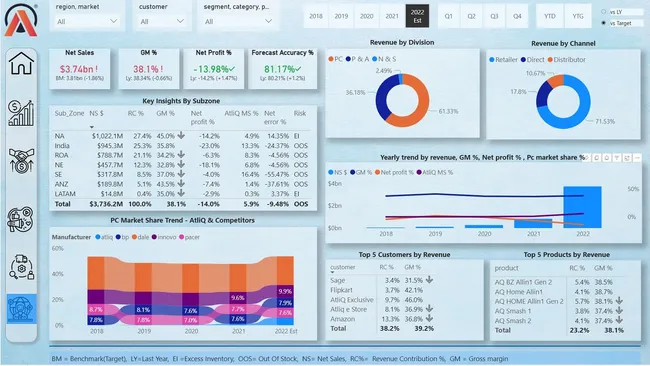
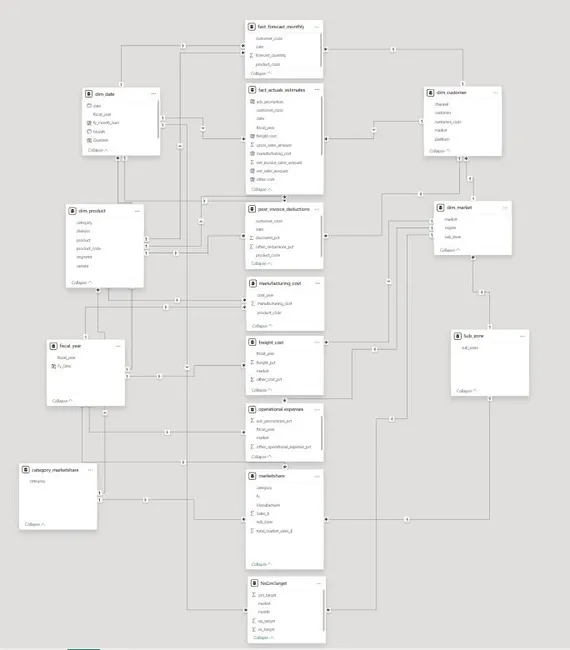
I enjoy transforming raw data into meaningful insights and building dashboards that help businesses make better decisions. My experience includes developing end-to-end Power BI solutions, gathering business requirements, defining KPIs, performing data transformation with Power Query and SQL, designing star and snowflake schemas, and creating advanced DAX measures.
I also focus on Power BI performance optimization using DAX Studio and Performance Analyzer, along with Power BI Service, gateways, and scheduled refreshes.
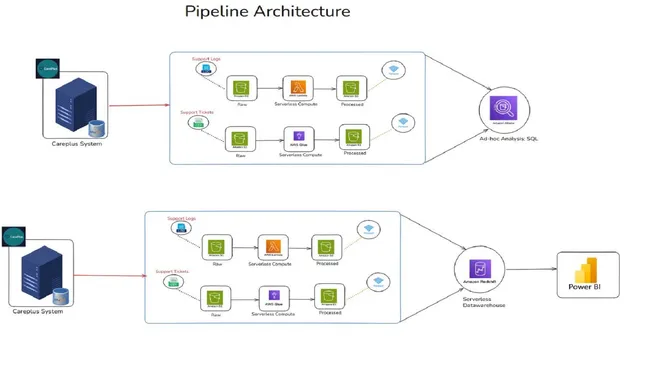
I’m continuously expanding my skills in Python, cloud technologies, and data engineering, with the goal of building scalable, reliable, and impactful data solutions.
My goal is simple: turn data into decisions.
Power BI
Python
SQL
Excel
Stakeholder Management
Data Analysis
Data Modeling
Requirements Gathering
Insights Generation
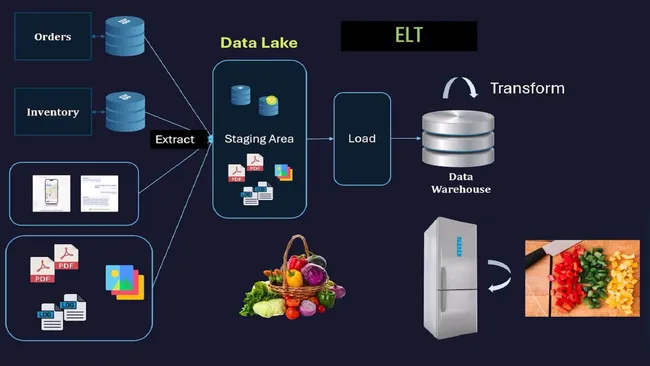
ETL / ELT
Story Telling
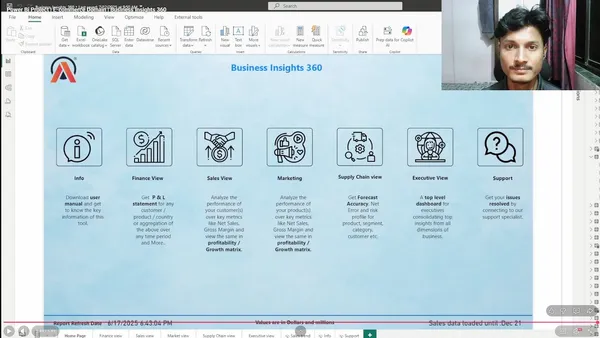
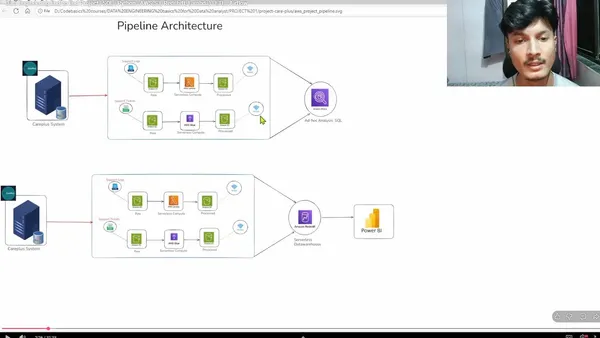
Domain/Function: customer-support service
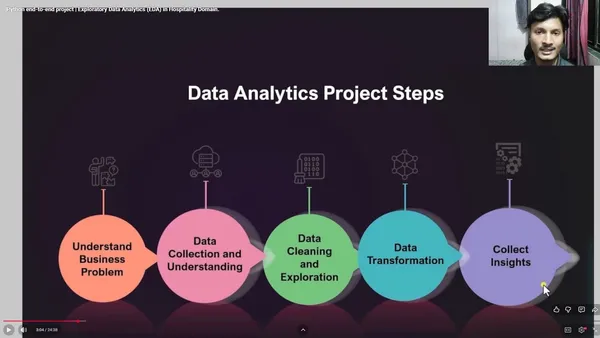
Domain/Function: Hospitality
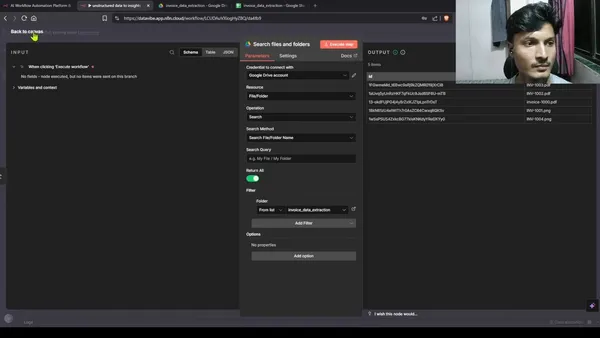
Domain/Function: N8N WorkFlow Automation
Data Analyst April 2022 – Present
eClerx Services Ltd. Navi Mumbai, India
• Own end-to-end Power BI delivery for Finance, Sales, Marketing and Supply Chain teams, from requirements and
mock-ups through ETL, data modeling, DAX, deployment and post-release support.
• Automated recurring reporting with executive-level dashboards, replacing a 3-day manual reporting cycle and
improving operational efficiency by up to 16%.
• Run requirement sessions with business stakeholders and share mock-up dashboards before development, so KPIs,
definitions and visuals are agreed before the full build starts.
• Connect MySQL sources to Power BI and run Power Query ETL on 1M+ operational records: de-duplication,
null handling, data-type standardisation and business-rule transformations, so reports run on clean, consistent data.
• Design star-schema semantic models with fact and dimension tables and correct relationships and cardinality, and
build a library of reusable DAX measures for YoY growth, rolling trends, contribution and period-over-period
analysis.
• Improved report performance by up to 18% by profiling slow measures, heavy visuals and model bottlenecks in
DAX Studio and Performance Analyzer, then reworking the DAX and model design.
• Publish and govern reports in Power BI Service: manage workspaces, apps and access, apply Row-Level Security by
user group, keep data current with scheduled and incremental refresh via the gateway, and promote releases through
deployment pipelines.
• Perform root-cause analysis on campaign, sales and operational data, tracing YoY trends and variances to the regions,
products and segments driving them, and present findings to stakeholders.
• Validate report outputs against source data, handle ad-hoc analysis requests in Excel, and mentor two colleagues in
Power BI development and DAX.

Excel: Mother of Business Intelligence

Get Job Ready: Power BI Data Analytics for All Levels 4.0

Soft Skills Bootcamp: Communication, Productivity & Personal Branding

Mastering Time Management & Deep Work

SQL Beginner to Advanced For Data Professionals

Python: Beginner to Advanced For Data Professionals
Feel free to get in touch with me. I am always open to discussing new projects, creative ideas or opportunities to be part of your visions.
© 2026 Codebasics.io. All Rights Reserved